How to collect analog sensor data into an SQL database
With the help of sensors we can collect information from our environment. These sensors detect different physical changes (e.g in temperature, light, sound and soil mosture values) and generate an electrical analog signal. There are also digitals sensors which contain the ADC (analog data converter) device.
What is an ADC?
The ADC can convert analog signals to digital data. This step is useful because the data collected by analog sensors can be processed, manipulated, computed, transmitted or stored after the conversion. In this case we will save our collected analog data into an SQL database.
Here you can read about the different types of analog sensors:
1. Temperature sensor
Mostly used thermistor is the NTC (Negative Temperature Coefficient). This type of sensor is based on resistance change.
If the temperature increases the resistance decreases. The increase of resistance value causes a voltage drop.
What you can use it for?
- Gardening purposes: collect important data of temperature changes which can affect your plants.
- Heater controlling: e.g 3D printer, indoor temperature
2. Light sensor
A light sensor can be used to detect the current ambient light level, for example how bright or dark it is. There are different types of light sensors, including Photoresistors, Photodiodes and Phototransistors. The most suitable sensor type for common purposes is Photoresistor. It works like the previously mentioned NTC sensor but in this case an increase of light intensity causes resistance decrease.
Why is it useful?
- Communication: special phototransistors can receive infrared lights
- Measure light intensity: e.g motion sensor, camera devices
- Special sensors can identify colours.
3. Soil moisture sensor
A soil moisture sensor is used to measure the moisture content of the soil.
The sensor is made of metal probes.
The resistance of this sensor informs you about the moisture levels.
You can create a simple setup that will read and monitor the water level value, and tells you whether the soil is wet or dry and needs watering.
If you would like a self-watering system you can add a water pump to the system. With this feature regulating the watering cycles for optimal plant growth is possible.
For example:
- For making irrigation systems more efficient.
- Following a recent rainfall event.
- Prevent over-watering
- Agricultural and environmental science can use this method for climate research.
4. Sound sensor
A sound detector is a small board that combines a microphone and an amplifier. It provides not only an audio output but an analog representation of its amplitude too. It can be used to detect the sound strength of the environment. The value of output can be adjusted by the potentiometer. This sensor is applicable for detecting changes e.g. if the sound is louder than the set point you have defined.
Examples:
- You can detect whether a motor is running or not.
- In the presence of no sound and no motion, you may go into an energy-saving mode and turn off the lights.
- Turning lights off and on by clapping.
- Creating light organ using LEDs.

Now that we know more about analog sensors and their functionalities, it is time to create your own project! Let’s see what we need for creating such a system.

Figure 5 shows how an analog data can be converted (using an ADC e.g. Arduino devices) and then saved into an SQL database using Ozeki 10. (Figure 5)

On Figure 6 you can see that if a change in the voltage value occurs then the gathered data is processed by an Arduino board (the ADC) and then the digital form of the data is saved into the SQL database. (Figure 6)

Figure 7 presents how the form of an analog signal changes when converting to digital signal. (Figure 7)
Now comes the configuration of our tools! Watch the video tutorial and follow our step-by-step guide below in order to learn how you can save your measured data into SQL database.
Step 1 - Connect the devices
First, connect the analog sensor (in this example we use a sound sensor) with the analog sensor cable. (Figure 8)

Then plug the cable into the Arduino device (e.g Arduino Nano). (Figure 9)

Finally, you have to create a connection between the sensor attached to an Arduino and a PC. Use an USB cable to make it happen. (Figure 10)

Step 2 - Set up the Arduino board
Open the software of Ozeki 10 and on the home page click on 'Help' and then 'View Help'. (Figure 11)

Then find 'Analog Sensor' in the 'Sensor' menu and choose the type of device you would like to use for converting the gathered analog data. In this case let's select 'Arduino Nano'. (Figure 12)

If you scroll down, you can see the source code which needs to be installed on the selected controller device.
Highlight the full code then right click and choose 'Copy'. (Figure 13)

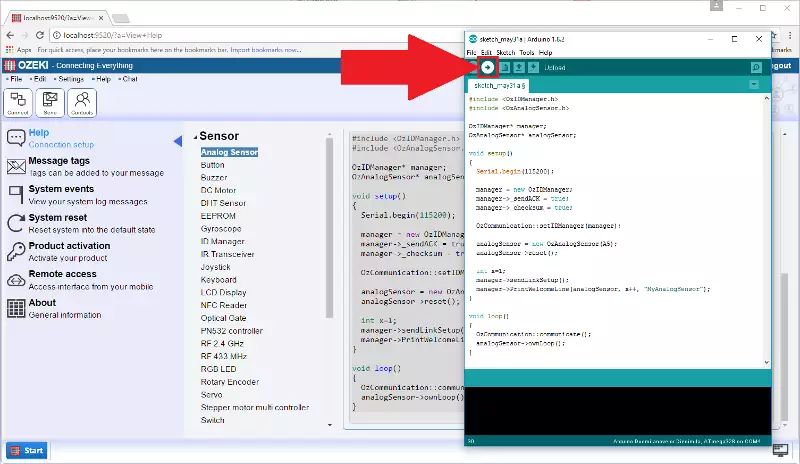
Now paste the selected source code into the Arduino IDE environment and click on the 'Upload' icon indicated as an arrow. (Figure 14)
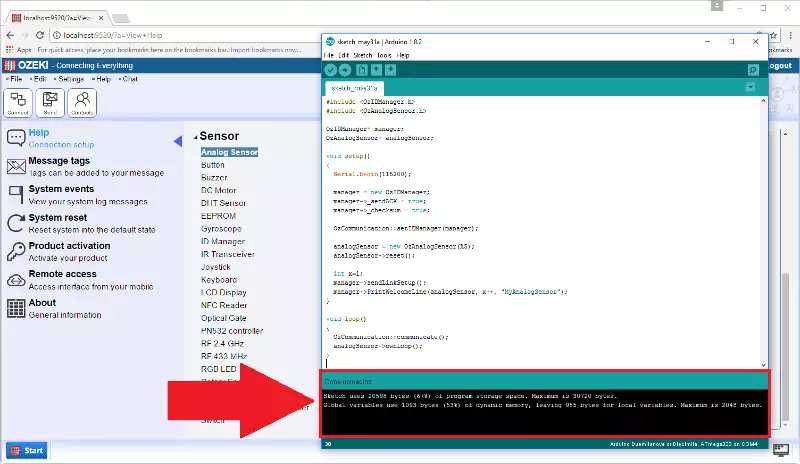
After the successful upload you can see some information about the uploaded code. (Figure 15)
Step 3 - Set up your analog sensor connection
Let's go back to the home page by clicking on the Ozeki logo in the left corner. In the 'Connections' list select 'MyAnalogSensor@localhost'. (Figure 16)

On the new page you can see details of your analog sensor connection. Now go to 'Test' menu in order to start measuring data. (Figure 17)

If you click on the 'Measure' button you can see that your analog data has been measured and converted to digital signal and its value is shown on the list. (Figure 18)

Now click on 'Configure' menu and in the 'General' tab you can see 'Periodic read' groupbox. Tick the checkbox which enables the option to read data periodically. (Figure 19)

Then you can set a time interval for reading the data. (Figure 20)

If you are finished with the configuration then click 'Ok.' (Figure 21)

If you go back to 'Test' menu then you can see that data have been measured after the time interval you have previously defined passes. (Figure 22)

Step 4 - Set up a MySQL connection
To the left 'Connect' option can be found. Click on it and you can see a menu bar below it. Select 'Databases' in order to start setting up your database connection. (Figure 23)

Now you have to click on 'Create new database connection' and to the right a list of database types will appear.
Select 'MySQL' connection. (Figure 24)

Go to 'General' tab and in the 'Connection settings' groupbox you can see default parameters of the MySQL connection. (Figure 25)

As a next step provide the name of your created MySQL database, the userID and password (if needed) to set up the connection. If finished, click 'Ok' to save the changes. (Figure 26)

Nice job! The MySQL database connection has been successfully configured and has appeared in the 'Database connections' list! If you a see a green circle next to the database then it means it is available. (Figure 27)

Step 5 - Create an SQL messaging connection
Now go to the 'Connections' menu and click on 'Create new connection'. (Figure 28)

To the right a window appears which contains the different type of connection methods. Let's select 'Application'.
(Figure 29)

Then choose 'SQL' connection. (Figure 30)

In the 'Receive' tab a textbox can be seen where we have to enter SQL INSERT statement. In our case it is: INSERT INTO sensor (Value, Time) VALUES ('$messagedata', '$receivedtime'). SQL queries make it possible to define which parameters of the collected data you would like to save into the database. If finished with providing the code then you can click 'Ok'. (Figure 31)

Now it is time to create a route which makes it possible to forward the measured data from Ozeki's software to your created database. Go to 'Routes' menu and then click on 'Create new route'. (Figure 32)

In the 'General' tab you can see 'Settings' groupbox where you can specify the route of the data. First, click on the 'From' box and select the analog sensor connection. Then you have to provide a route where you would like to send the gathered data to. Click on 'To' option and choose the SQL messaging connection which you have created in the previous step. Finally, click 'Ok' to save the settings. (Figure 33)

Step 6 - Check the database
Now open a web browser and type into the search bar: 'localhost/phpmyadmin/'. Provide your login data and press 'Go' to gain access to your MySQL database. (Figure 34)

On the left side a menu can be seen which contains the databases. Find your created database (in our case its name is ozeki) and the table within this database. Click on it and see what data it contains. (Figure 35)

And the values of the measured data can be seen. All saved into the database! (Figure 36)

More information